Interactions in a Day
Graphic Design | Data Visualization
Overview
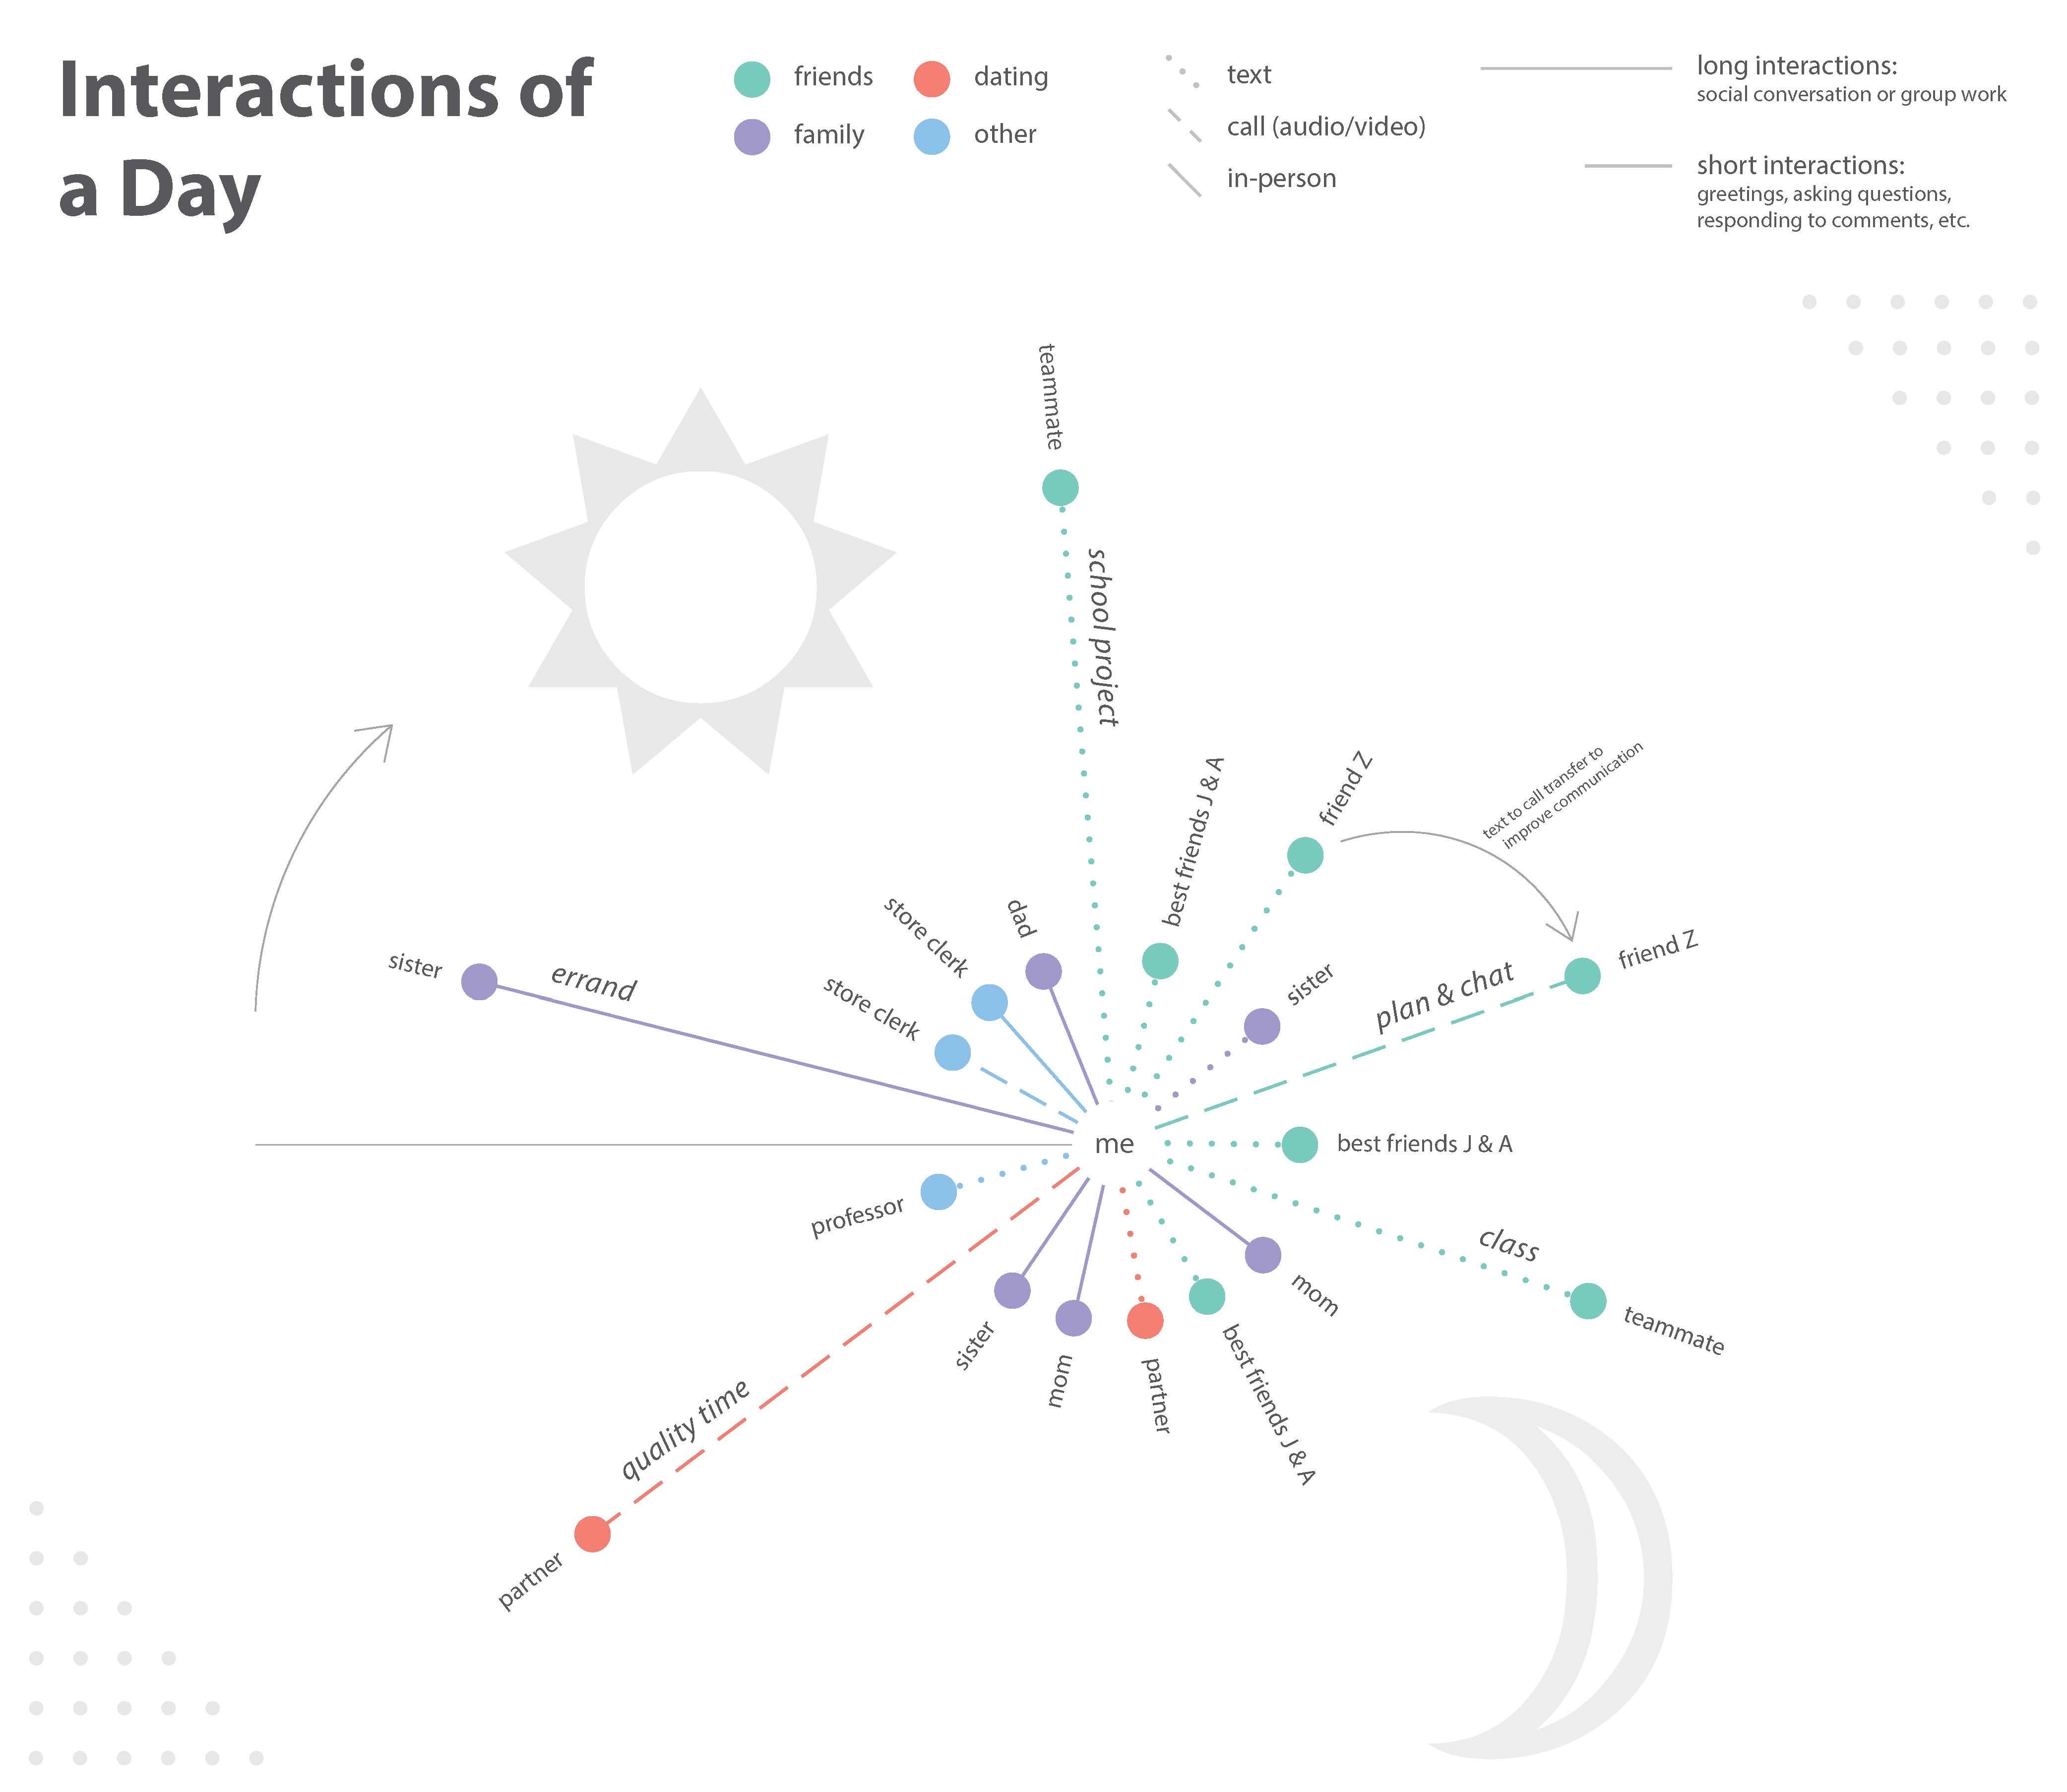
The goal of this project was to track data for a day and create a graph based off that data. I began by brainstorming, then I wrote everything I did the day before; after review, I thought creating a graph of my social interactions would be interesting. Our social lifes are dynamic. As social creatures, we communicate and connect with others frequently.
Tools
Illustrator: vector graphics editor
ColorBrewer2: colour scheme for data tool
Value
Displaying our social interactions from our day can help us understand and reflect on our social patterns. How do we feel about our social patterns?